Learning with KubeArmor: My LFX Mentorship Journey

I am a undergraduate student in Information Techonology Engineering at IIITA with great interests in computer science and software development . I have contributed to some open source projects at Red Hat and CNCF
Passionate about open-source ,cloud native , developing full stack solutions and distributed systems
I enjoy writing blogs to share my experiences and give something valuable back to the community :)
Hello everyone, my name is Sibasish Behera. I am an undergraduate graduate in IT, interested in cloud-native and distributed systems. This spring I participated in the LFX mentorship program, and my project community is KubeArmor.
KubeArmor uses eBPF and Linux Security Modules (LSM) to provide a policy-based system to restrict any unwanted, malicious behaviour of cloud-native workloads at runtime. You can read more about KubeArmor at https://kubearmor.io/.
Acknowledgement
I would like to express my gratitude to Barun Acharya, Rahul Jadhav, Anurag Kumar, and Ankur Kothiwal, my mentors who have consistently provided guidance and unwavering support throughout the mentorship program. Their assistance has been invaluable to me.
I am deeply grateful to the KubeArmor community for their ongoing support and guidance during my participation in the program. Their assistance was crucial in helping me complete my project and gain valuable skills and experience.
Additionally, I would like to extend my appreciation to the Linux Foundation and the Cloud Native Computing Foundation for offering mentorship programs that allow us to collaborate on open-source projects under expert guidance. Their initiatives have played a significant role in shaping my learning journey.
Monitoring and Dashboard in KubeArmor?
Problem Statement
To make sense of the large amount of telemetry data emitted by KubeArmor, the plan was to explore integrating Syslog support with either the E(F/L)K or PLG visualization stacks. These stacks allow parsing, filtering, and visualizing KubeArmor telemetry data in a dashboard, making it easier for users to monitor and analyze unwanted, malicious behaviour of cloud-native workloads at runtime, as checked by KubeArmor. KubeArmor had already added Syslog support to its relay service, which could be parsed by FluentD.
Upstream Issues:
The Solution
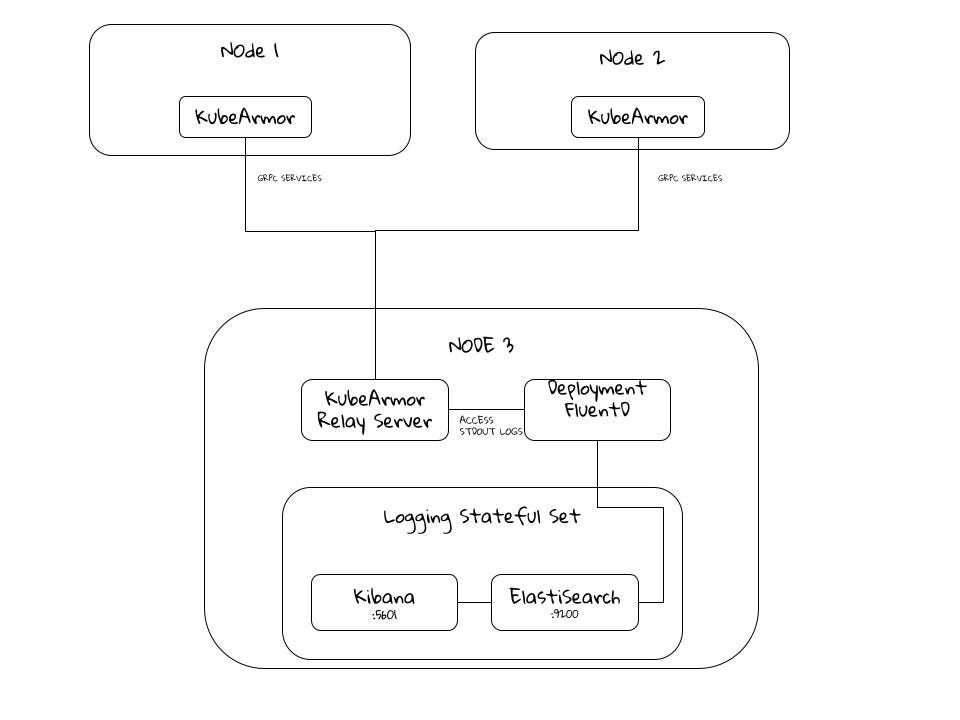
In this implementation, Fluentd was used as a part of DaemonSet, accessing the log files /var/log/containers/kubearmor-relay-*.log, and parsing them.
The Fluentd workload sent the parsed logs to the Elasticsearch cluster statefully through the exposed REST service at elasticsearch.kubesystem.svc.cluster.local on port 9300.
The indexed data in Elasticsearch was queried by the configured Kibana deployment, which could be further aggregated and transformed into various visualizations such as graphs, tables, maps, etc.
The results were as expected; we got good dashboards!
However, during discussions with the KubeArmor community, we discovered that using FluentD could be a bottleneck in the design. The way FluentD worked in KubeArmor was by collecting stdout from the container, parsing it to JSON, and adding the necessary metadata. However, the whole process of aggregation and parsing was unnecessary if there could be a way to collect directly from the gRPC endpoint. Additionally, running FluentD as a DaemonSet could be a possible security loophole due to cluster access. To address these concerns, we have explored alternative solutions that can help improve the efficiency and security of our solution.
Improvement
The approach to creating an Elasticsearch adapter, which would be a part of the relay server was the most practical. This would eliminate the need for FluentD. Here is the primary structure of adapter.go in the KubeArmor-relay-server:
/*
kaClient is the client listening to the kubeArmor grpc service
esClient is the elastisearch client configured to listen to the elastiseach stateful set cluster
bulkIndex allows the data to be aggregated and flushed in a single request
default set to 30sec or 10Mib volume
*/
type ElasticsearchClient struct {
 kaClient    *server.LogClient
 esClient    *elasticsearch.Client
 cancel      context.CancelFunc
 bulkIndexer esutil.BulkIndexer
 ctx         context.Context
 alertCh     chan interface{}
}

/*
bulkIndex is used to pass a interface like log, message or alert from kaClient
which is added to the bulkIndexer to be flushed to elasticsearch
*/
func (ecl *ElasticsearchClient) bulkIndex(a interface{}, index string) {
 ......
 data, err := json.Marshal(a)

 err = ecl.bulkIndexer.Add(
  ecl.ctx,
  esutil.BulkIndexerItem{
   Index:      index,
   Action:     "index",
   DocumentID: uuid.New().String(),
   Body:       bytes.NewReader(data),
   OnSuccess: func(){...},
   OnFailure: func(){...},
  },
 )
 if err != nil {...}
}
The high-velocity data streams generated by KubeArmor can overwhelm Elasticsearch with a large volume of requests.
To address this issue, the solution optimizes performance by utilizing parallel processing of bulk requests. This approach considerably improves throughput compared to handling individual requests separately.
Final Dashboards in Kibana
Here we have tried the set-up with multiubuntu and wordpress-mysql example from KubeArmor
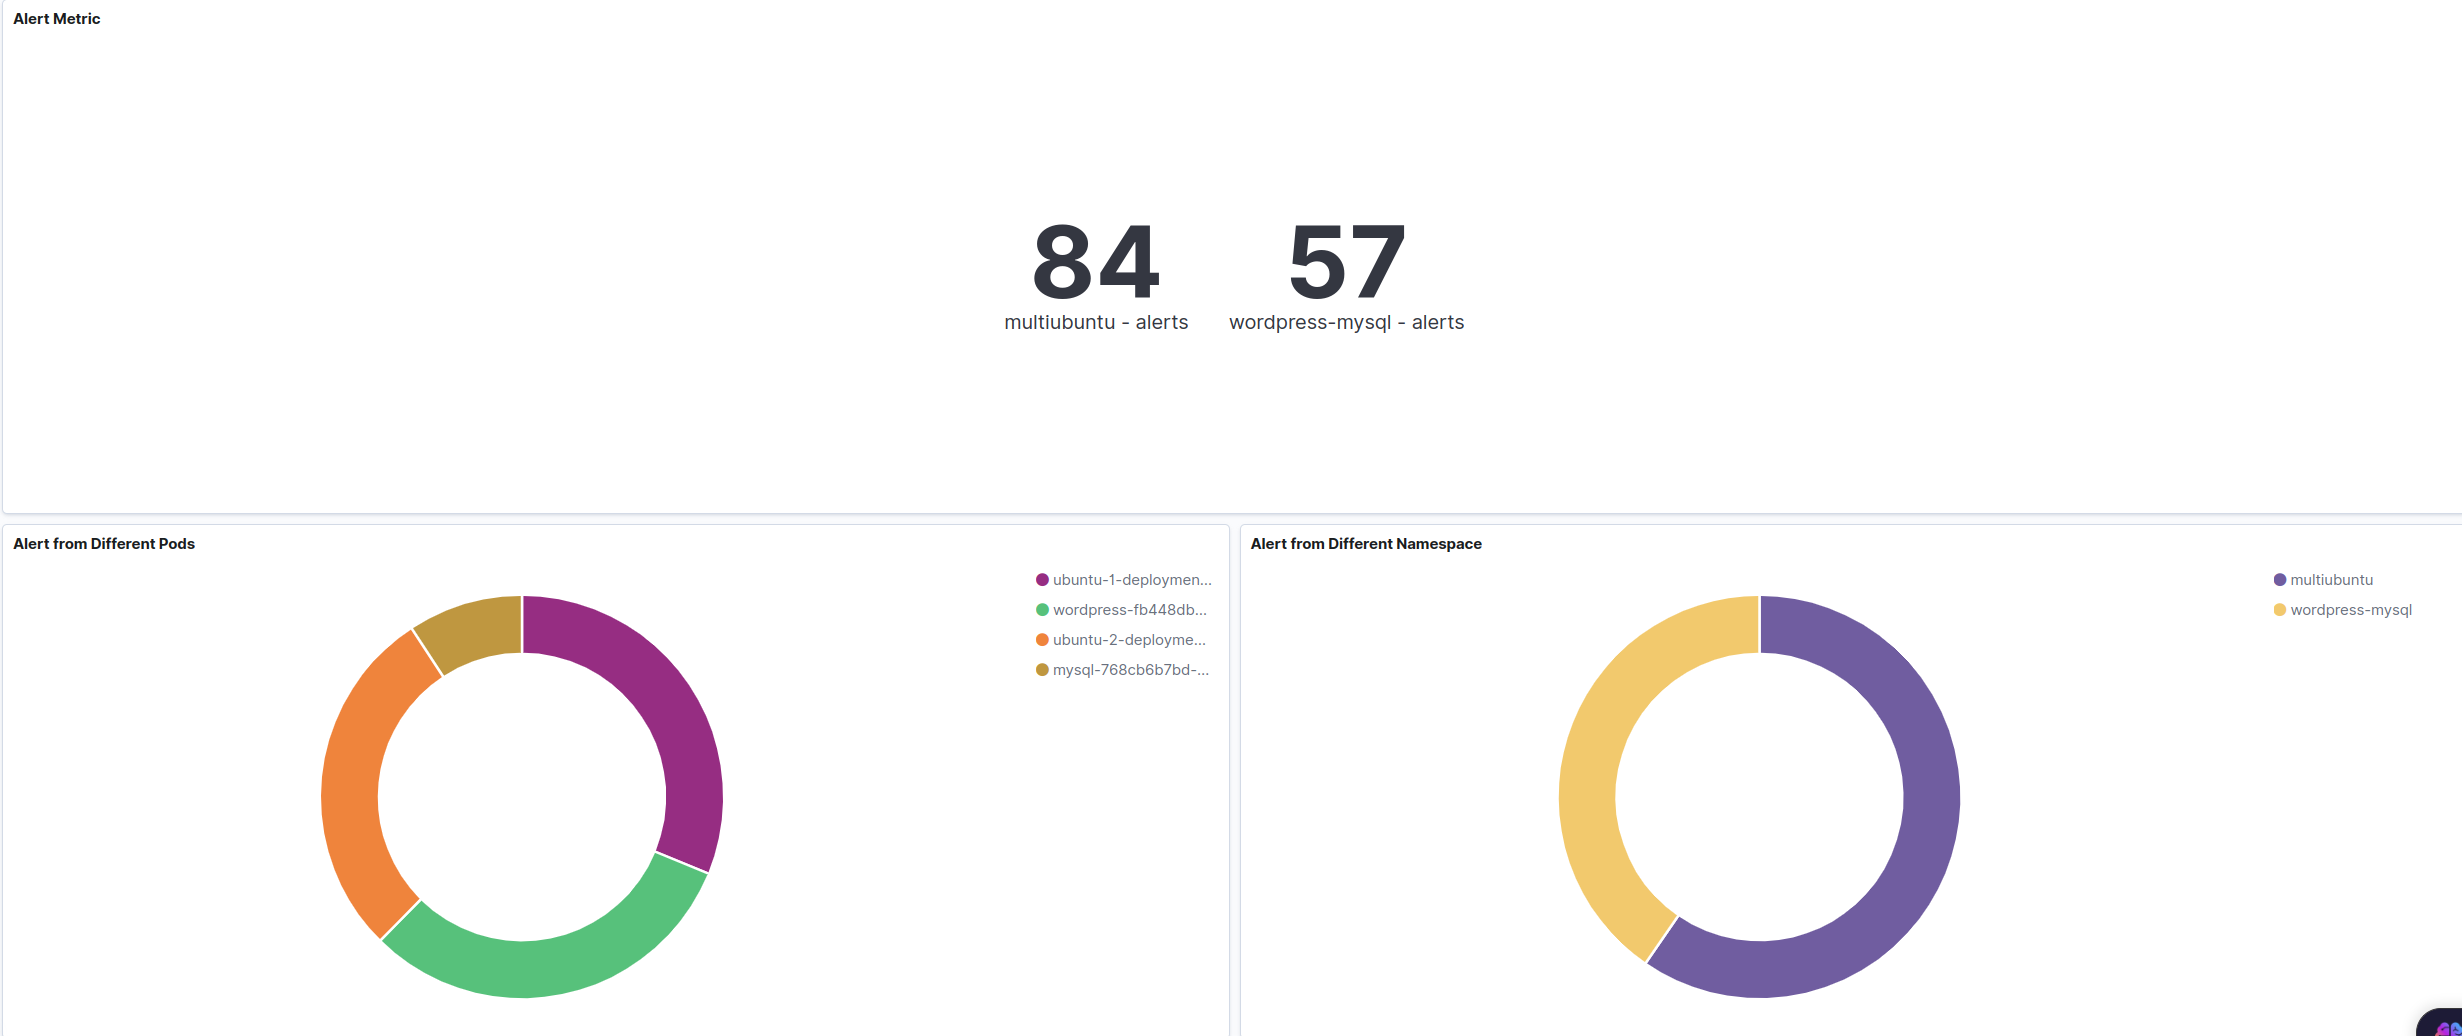
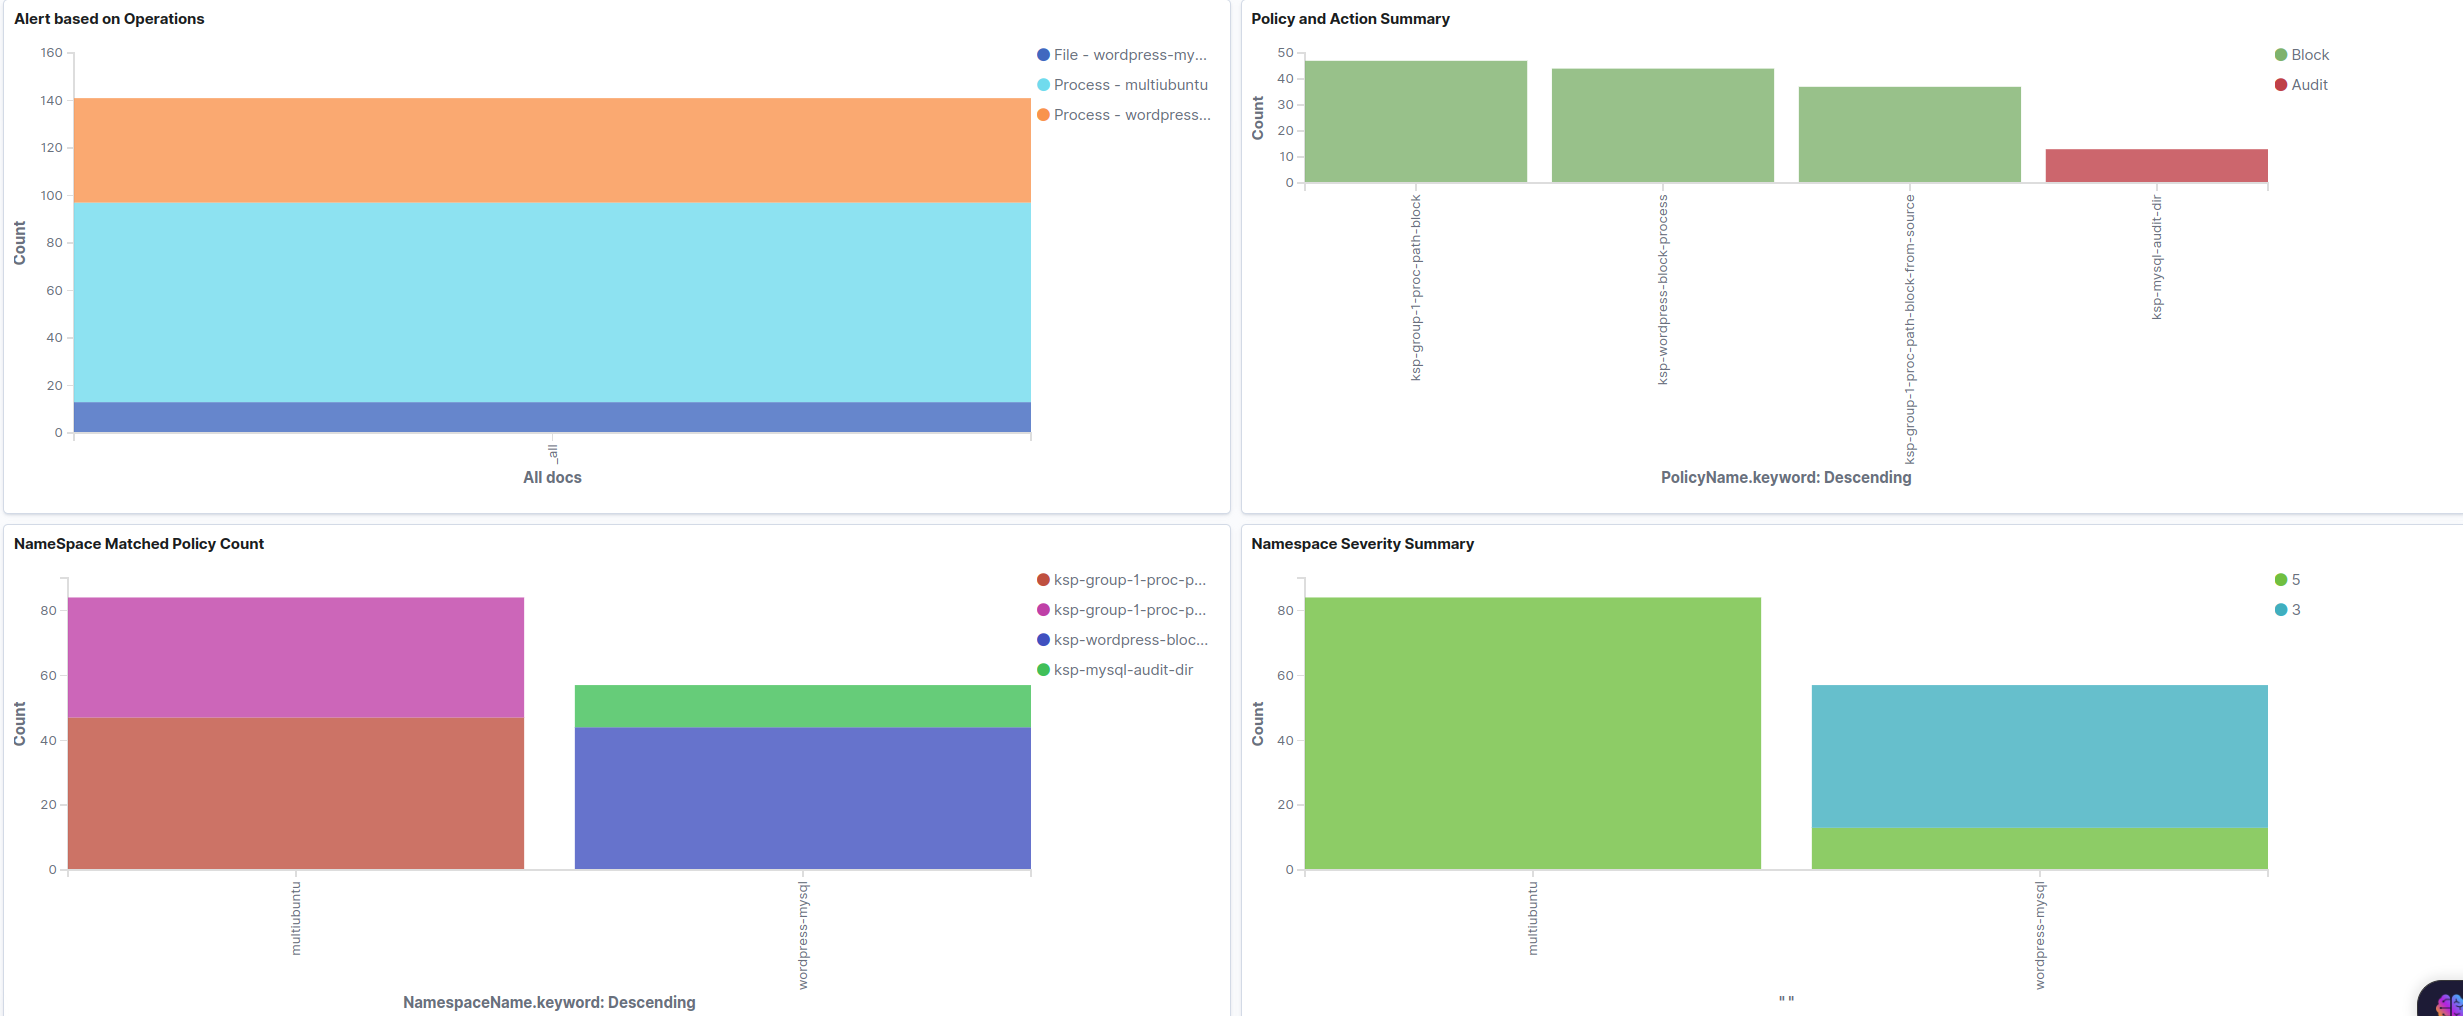
Kibana Dashboards
Here we can get various insight on :-
- Alert Metric
- Alert from Different Pods
- Alert from Different Namespace
- Alert based on Operations
- Policy and Action Summary
- NameSpace Matched Policy Count
- Namespace Severity Summary
- Alert Based on Tags
Loki Graphana Support For KubeArmor
KubeArmor has added a new feature that allows users to export logs using OpenTelemetry. This feature was contributed by Maureen Ononiwu, a fellow LFX mentee in the same term. With the Otel KubeArmor receiver, users can easily export logs to popular exporters like Loki and Splunk, making it compatible with existing monitoring and logging systems. This feature enables KubeArmor users to create useful Loki Grafana dashboards for visualizing and analyzing logs.


During the LFX mentorship period, I learned more about the Kubernetes ecosystem, Golang, observability, and container security. I will apply this knowledge to my future endeavours.
I would love to contribute more to KubeArmor as well as other cloud-native projects and hopefully learn a great deal in the process.
Important Links
Checkout KubeArmor:
https://kubearmor.io/
Intial EFK implementation :
https://github.com/TheRealSibasishBehera/kubearmor-elasticstack-logging/tree/dev
Elastisearch adapter PR (in RelayServer):
https://github.com/kubearmor/kubearmor-relay-server/pull/31
KubeArmor OTel-receiver:
https://github.com/Chinwendu20/OTel-receiver